The Observability Pyramid
The all-green outage (opens in a new tab)
Picture a team with a beautiful operations setup. CPU green. Memory green. Every service emitting traces, p99 latency well inside threshold, the status page a wall of checkmarks. Then someone from the business asks a simple question: are customers completing checkout right now?
Nobody in the room can answer it.
That gap, every technical light green while the one question that matters goes unanswered, is a failure of priorities, not tooling. And once you notice it in one place, you start finding it everywhere.
The pyramid (opens in a new tab)
You already know the testing pyramid, usually as an argument about cost: unit tests are cheap, end-to-end tests are expensive, so build accordingly. There's a second lesson hiding in it. The few checks closest to the user are the ones you can't afford to skip, because great unit coverage with no end-to-end tests leaves the thing users actually experience unverified. Observability has the same shape, and most teams have it upside down.
Picture four tiers:
- Business and transaction KPIs. Revenue per minute, orders, signups, checkout success. Few in number, and the ones the business notices first.
- User-facing reliability (SLOs). Latency, error rate, and availability of the journeys users actually take, not of the box.
- Application telemetry. Traces, dependencies, app-level metrics. The "why" layer.
- System and infrastructure telemetry. CPU, memory, disk, network. Voluminous, cheap, automatic, and furthest from anything a customer feels.
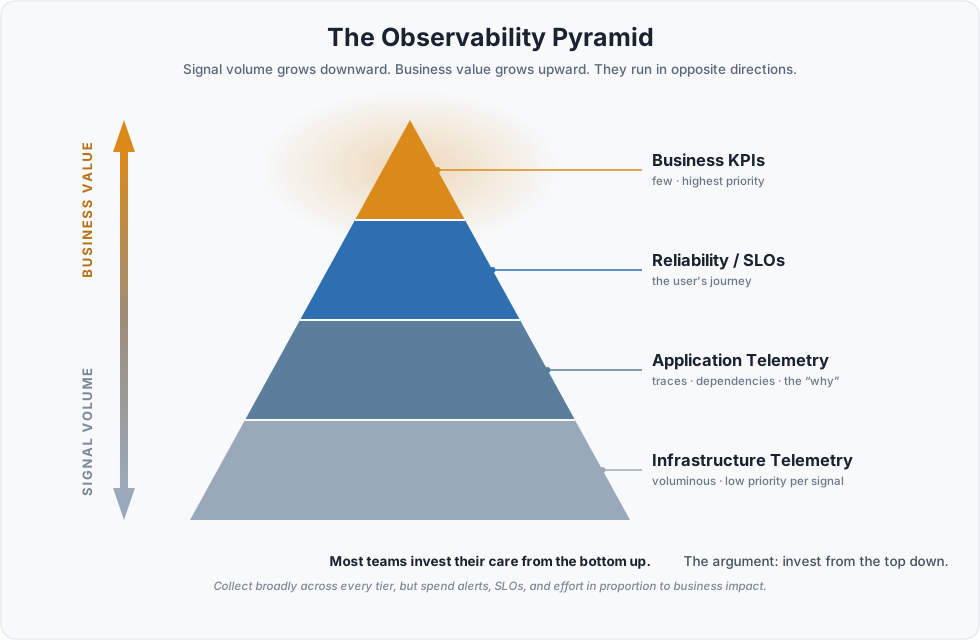
Signal volume grows as you go down. Proximity to business value grows as you go up. Those run in opposite directions, and that is the whole problem. The familiar "three pillars" draw logs, metrics, and traces as coequal columns. The pyramid is a ranking, and a ranking is a stronger claim than the familiar advice to align observability with the business. Alignment treats business and technical signals as coequal things to correlate. A ranking says the business outcome is the root of the hierarchy: it decides what is worth instrumenting and what is worth waking someone up for. The fastest way to see the difference is to watch one incident play out.
What it looks like in practice: the false decline (opens in a new tab)
An e-commerce company, three teams, three tiers. A platform team owns infrastructure and alerts on CPU, latency, and 5xx rates. A payments and risk squad owns checkout and the fraud rules. Product owns the conversion funnel, reviewed every Monday.
At 2:14pm a routine update tightens a fraud rule. Correctly-formed transactions from EU-issued Visa cards now trip it and get declined by the processor. The app does the right thing: it shows "your card was declined, please try another" and returns a 200. The customer retries once and leaves.
Nothing errored. A decline is a normal business outcome, so the 5xx rate is flat and infrastructure is green, honestly green. The decline-rate bump, if anyone tracks it, is confined to one card range and lost in the aggregate. Blended conversion dips a few percent, inside daily noise, invisible until Monday. Nine hours later a support spike escalates into a war room: the platform engineer says every dashboard is green, payments sees no errors because there were none, and product knows conversion is down but not why. Three partial views, no wire between them, MTTR in hours.
Now run it top-down. Checkout success is defined from the customer's outcome, completed orders over checkout starts, emitted live and tagged by region, card type, and platform, so a valid decline still counts as a non-success. An SLO pages on it per segment rather than blended: 98% over a rolling fifteen minutes. To explain that number, you promote the processor's decline-reason codes into the trace, and one team owns the wire from the KPI down to it.
Replay it. By 2:29 a page fires: checkout success, EU and Visa, 73% versus 98%, decline-reason risk_rule_42, correlates with a risk-config change. On-call clicks through to the trace, sees the reason, rolls the rule back. MTTR in minutes. The infrastructure dashboards were green the whole time, and that was fine, because they were never the thing being watched.
This whole class of failure, the kind that rides a legitimate response path where nothing throws, is invisible to error-centric monitoring by definition. The pyramid catches it because it starts from "did the customer succeed?" instead of "did anything break?"
The business question is the spec (opens in a new tab)
That story is the argument in miniature. Instead of cataloguing every signal a system can emit and then asking what it's good for, you start with a question, how do I know checkout is working? That question is the specification: it defines what "working" means, what counts as broken, and how fast you need to know. Everything below exists to answer it. You work backwards from the outcome to the telemetry, never forwards from telemetry to a hoped-for insight.
This is also why "we already collect business metrics" misses the point. Plenty of teams have them. Far fewer let them govern the rest of the observability; more often they sit on a separate dashboard while the alerting below goes its own way.
None of this means the top is where your attention lives. Business metrics lag, and localized failures hide in the aggregate, so you still watch leading indicators lower down. But those indicators are only legible as warnings because the top defines what they threaten.
The top isn't where you look. It's where meaning comes from.
Collect broadly, spend care narrowly (opens in a new tab)
The most useful distinction here is between collection and care.
Collection is capturing raw telemetry. It's cheap. Keep all of it, query it later, debug the thing you never saw coming. No argument there.
Care is the expensive part: the alerts, the SLOs, the dashboards, the on-call burden, the work to make a signal trustworthy. Care is finite, and it's the thing to ration by business importance. "Alert on anything and everything" sounds responsible, but it is the bottom-up disease wearing a halo, treating every signal as equally worthy of scarce attention. A feature the business doesn't depend on should not command the same 3am page as one that's critical.
One refinement keeps this honest: ration care by the damage done when something fails, not by how much anyone loves the feature. Blast radius counts. The boring shared service nobody watches is often what takes down the thing everybody cares about.
The gap is usually organizational (opens in a new tab)
The inversion is too common to blame on ignorance. In most large organizations the tiers are owned by different teams. Infrastructure and the observability platform sit with one group; business KPIs sit with product, analytics, or BI. Different tools, different dashboards, different people, almost no wires between them.
Sit in the seat of the team holding the pager. They own the lower tiers and have no line of sight into business impact, so they alert on everything they can see. "Page on any error" is the only rational default when the layer that tells you which errors matter lives in another department. The silo manufactures the bottom-up posture, and collecting business metrics in a separate room doesn't fix it. Nothing about the pyramid requires gathering a tier you're missing. The tiers exist; what's missing is the wiring between them, so the top can govern what the bottom pages on. That is an ownership problem before it is a tooling one.
This is bigger than observability (opens in a new tab)
Zoom out far enough and the pyramid stops being about observability at all. It's one instance of a broader engineering principle: start with the business outcome, derive the success criteria, derive the operational signals, then derive the implementation. Good testing works this way, and so do SLOs and architecture reviews. Observability just happens to be where people most often reverse the direction, because the lower layers are easier to build, and building something is easy to mistake for progress.
A test for every signal (opens in a new tab)
None of this requires redesigning your observability stack, and that isn't the place to start anyway.
Pick one customer journey that genuinely matters and define what success means for it. Then start asking a different question of every alert, dashboard, SLO, and trace you already have:
What business outcome does this help you explain, predict, or protect?
The answer can't stop at "it's useful." You should be able to draw a line from every signal you actively care about to the outcome it exists to support. Take a memory-utilization alarm on a database. High memory, by itself, is neither good nor bad. The alarm earns its page because that database supports a service, the service supports a customer journey, and the journey supports a business outcome. If you can't draw that line, the signal may still be worth collecting. It just doesn't deserve the same care.
That makes any signal interrogable:
Checkout success            ← business outcome
      ↑
Checkout-success SLO
      ↑
Payment API success rate
      ↑
Payment service latency
      ↑
Aurora database memory      ← the alarm that pages you
Ask why you page on Aurora memory. "Because databases are important" no longer cuts it. The real answer runs up the chain: it protects payment-service latency, which protects checkout success, which protects revenue. A signal that can't trace a path like that to the top is one you're caring about for its own sake.
So the pyramid is really a dependency graph folded into a hierarchy. Every signal you care about is a node, and every node should have an edge pointing upward, toward the thing it protects. The business outcome sits at the top, each layer beneath exists to explain or protect the layer above, and every incident teaches you where an edge is still missing.
Climbing the right way (opens in a new tab)
Business metrics aren't the prize you earn at the end of the maturity journey. They're the starting point that gives everything beneath them its purpose.
The team in the opening story didn't need more telemetry. They had plenty. They needed a definition of "working" that every layer of observability existed to serve. The point was never to know everything the system is doing. It was to know whether the business is still working, and why not when it isn't.
If your observability feels upside down, don't start at the bottom. Climb to the top, then work your way back down.